
To show data visualization skills on a resume, identify the data question, the source you handled, the chart or dashboard you produced, and how you checked the result. A software badge alone does not show that your visuals were accurate or useful. Separate dashboard editing from data modeling, publishing permissions, and business decisions. Describe what you built or maintained, why the display suited its audience, and what someone else reviewed.
Describe the decision a visualization was meant to support
A chart can be visually attractive but useless if it answers the wrong question. Start with the audience: did a supervisor need a weekly workload summary, did a program manager need categories compared, or did a research team need an exploratory trend? Then describe the question your view addressed. O*NET lists generating reports, maintaining dashboards, documenting specifications, and testing reporting output among business intelligence analyst activities.
Not every person who creates a chart is a business intelligence analyst. If you prepared a simple spreadsheet graph for a class, call it a project and describe the method. If you maintained a department dashboard, identify the part you owned. Avoid writing “developed company analytics strategy” unless you truly led that work and can provide real evidence.
Show where the data came from and what you checked
Before visualizing information, someone must verify that the rows, dates, categories, and totals make sense. If you cleaned a dataset, explain how: matched IDs, checked missing values, removed duplicates under a defined rule, or reconciled totals to a source report. If your role began after data preparation, do not imply you managed the full pipeline. Good resumes tie data quality to a specific deliverable.
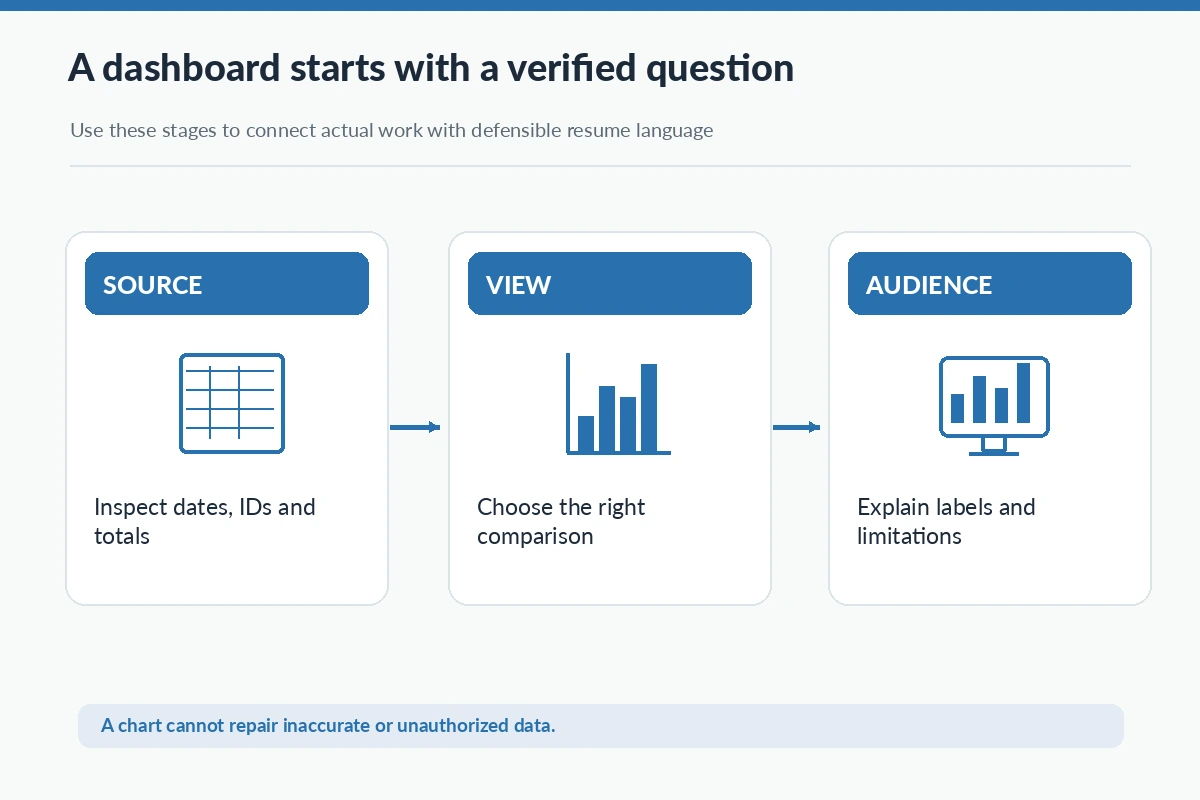
Example: “Reconciled weekly support categories against the source export before updating the team dashboard.” This shows accuracy and repeatable work. Never invent a data quality percentage, throughput improvement, or business impact to give the bullet a stronger ending. If an issue was referred to another analyst, make that handoff clear.
Choose chart types based on actual comparison needs
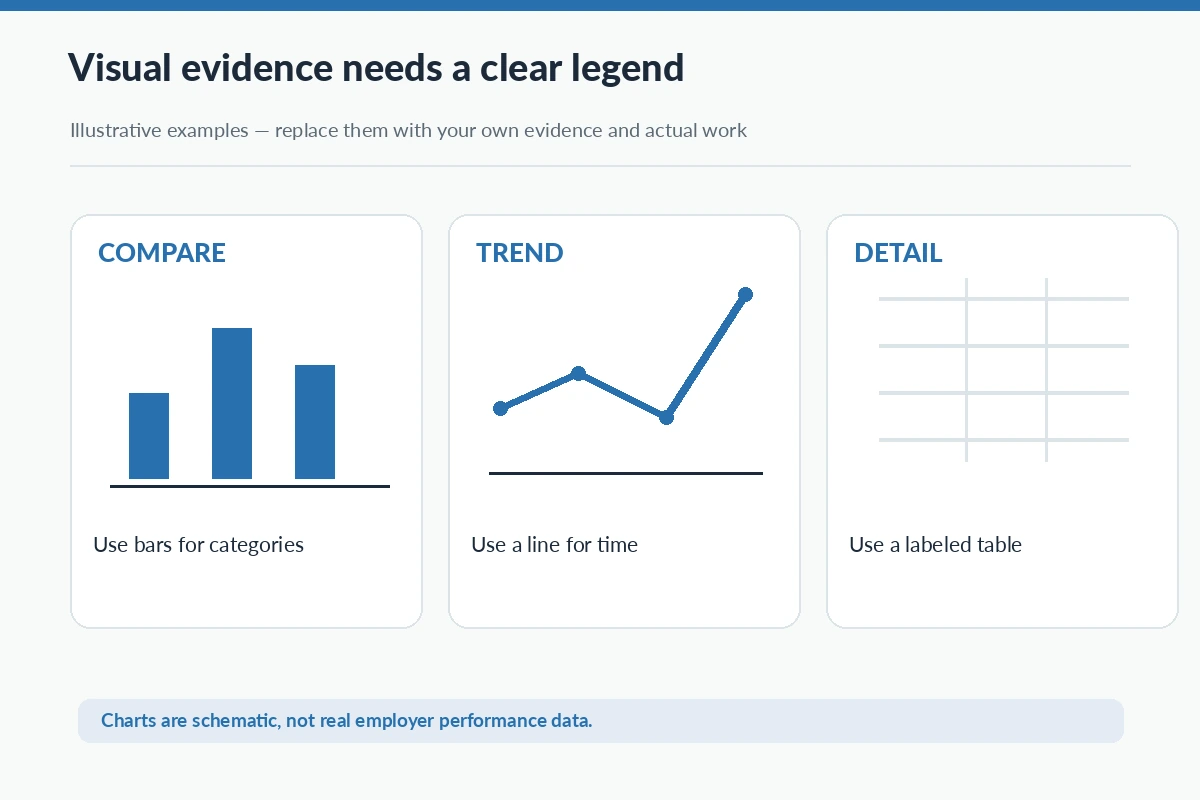
A bar chart may help compare categories, while a line chart can show movement across time; tables can preserve detailed values that a chart might obscure. What matters on the resume is the reasoning behind the format and any limits you communicated. “Selected a bar chart to compare ticket categories and added an explanatory note for incomplete records” is more credible than “Created cutting-edge visuals.”
Be careful with axes, units, time periods, and category definitions. A graph with an unlabeled denominator can mislead viewers even when every number is technically correct. If you reviewed a chart for scale and labeling, mention that quality step. Do not claim advanced statistical analysis merely because you adjusted colors or legends.
Name tools with the functions you really used
Spreadsheet charts, Power BI, Tableau, Looker, Python plotting libraries, and other tools appear in different job contexts. Name a platform only if you can demonstrate the feature you used, whether that was importing a CSV, building calculated measures, applying a filter, refreshing a report, or editing a visualization. “Maintained an existing dashboard and checked scheduled refresh output” differs from “Designed the data model.”
For a role requiring a tool you have not used, do not copy it into your skills list. Describe a transferable workflow you understand and be prepared to discuss what you would need to learn. CareerOneStop recommends short, relevant skills entries rather than an exhaustive technology inventory. Pair the tool with a project or experience bullet that substantiates it.
Write a resume bullet with a source and a check
Weak: “Expert in dashboards, reporting, and storytelling.” Stronger: “Built a project dashboard from a public dataset, validated category totals, and wrote captions explaining missing values.” The second version is an illustration, not a claim that you performed this exact project. It connects a deliverable to a verification action and makes the scope of work visible.
For paid work, adjust the sentence to match your job: perhaps you refreshed a supervisor-designed view each week or prepared an accessible static report for a stakeholder. Describe your contribution precisely. If a manager made the recommendation after viewing the report, do not say you personally approved the business decision.
Protect sensitive records and report access
Dashboards may display client names, patient information, internal revenue, or employee records. A resume or portfolio must not reproduce those screens without authorization, even if a screenshot seems harmless. Build a sanitized mockup or choose public data, and label illustrative charts accordingly. Removing names alone may not sufficiently protect confidential patterns or small groups.
Mention permissions accurately: “Prepared a filtered summary for authorized reviewers” is different from “managed enterprise access controls.” If a supervisor handled publication or access approvals, keep that distinction. A reliable analyst demonstrates both communication quality and respect for the data-use boundaries of the organization.
Test whether viewers can read the visual
Chart clarity includes descriptive titles, consistent units, legible labels, appropriate contrast, and explanations of missing or revised data. If you designed a dashboard for several audiences, state how you chose a suitable level of detail. An interviewer may be more interested in how you discovered a misleading category than in how many decorative charts appeared on the page.
Where a visual needed review by someone else, say what you checked and how feedback affected the result. For example, “Revised legend wording after operations staff flagged an ambiguous status label” can be evidence of collaboration and practical judgment. Do not infer a positive business outcome solely from feedback or from the existence of a dashboard.
| Experience | What you did | Proof to describe | Limit to respect |
|---|---|---|---|
| Source check | Matched IDs and totals | Verified input before plotting | Do not claim full pipeline |
| Chart design | Chose comparison view | Labeled units and scope | Do not confuse with modeling |
| Dashboard support | Refreshed existing reports | Checked output with owner | Do not claim access authority |
Explain the limitations as well as the result
A data visualization story should end with what the report could and could not support. If the source covered only one location or period, describe that scope. If late-arriving records changed a trend, explain how you annotated or refreshed the view. Avoid treating correlation as a proven cause or claiming the chart itself created savings. Accurate limitations demonstrate stronger judgment than unsupported certainty.
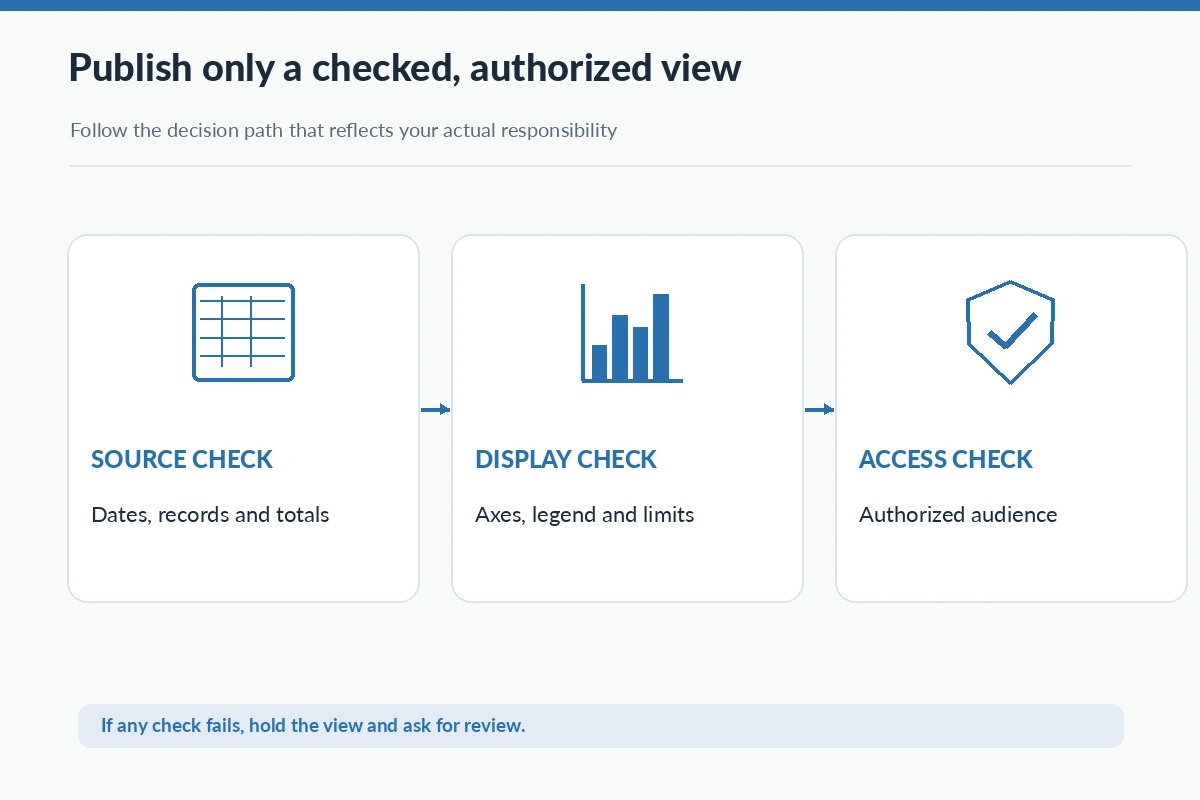
Before submitting the resume, test one project example: can you name the source, your processing step, the visualization, a validation check, the intended reader, and who approved distribution? If you can, a short bullet can carry genuine evidence without a long list of tool names or exaggerated claims.
How We Research and Verify Resume Examples
This article uses publicly available occupational and career guidance to distinguish a task a worker might perform from a claim a particular applicant can honestly make. All sample resume statements are illustrative, not biographies or verified employer results. The sources listed below were reviewed on 2026-11-05. Skills, authority, training, and credential requirements depend on the actual job and organization. For the site’s relationship policy, read the affiliate disclosure.
Source basis: CareerOneStop Resume Guide — CareerOneStop explains how to keep technical skills relevant and demonstrate the ones the job needs.; O*NET OnLine occupational profile — O*NET details report generation, dashboards, specifications, documentation, and output validation for BI analyst occupations.. Review original requirements before making legal, licensing, financial, or other consequential claims about your own scope of work.
More Resume and Cover Letter Guides
List only tools you personally used, with functions you can demonstrate, such as filters, charts, data imports, or report refreshes.
Yes, if you label it academic or personal, explain the public or synthetic data source, and do not invent employer results.
Describe the refresh, checking, labeling, or user-support tasks you performed rather than claiming you designed the data model.
Not without appropriate permission and privacy review; a public or synthetic example is usually safer for a portfolio.
Explain one check against a source total, date range, category definition, axis label, or reviewer feedback that you actually completed.